Update 8/06/2020 - California ICU Beds are at 80% capacity (after peaking at 87%), but case numbers are down. Daily case numbers at this level while manageable won’t allow ICU’s to treat many other patients apart from Covid ones until 2 weeks at least.
Update 7/21/2020 - California ICU Beds have settled down at 55% capacity for the last week or so. This is probably what steady state looks like.
Update 7/16/2020 - California Case Numbers Updated along with Google’s Mobility Data. Note the mobility changes over the July 4th Weekend.
Update 7/8/2020 - 5th July saw over 10K cases which requires us to change the scale on our graph below. Without adding extra capacity in the form of ICU Beds, it is unlikely that CA will want to loosen additional restrictions in mobility and commerce.
California’s Health and Human Services (CHHS) changed the format of their data, as did Google for their Mobility Data, and so it makes sense to revisit Mobility and Case Numbers with the new data. There are two broad changes in the Data being reported by the State of California. Prior to the 25th of June, Confirmed Cases and Suspected Cases, along with Confirmed ICU Covid Positive and Suspected Covid Positive ICU Cases, were reported as separate categories. Now Case numbers only reflect Confirmed Cases. While this makes sense for reporting moving forward assuming that California is testing adequately, it does skew the data which exaggerated the Case numbers for June, as compared to April-May. See here for comparison. The other change pertains to the numbers of Hospital, ICU, and Surge, Beds available.
Interpretation of the plot
This is a time-series plot comparing the change in mobility categories (non-grey colors) as measured by Google’s Mobility Data to the number of New Cases of Covid19 (in grey) as documented by California’s Health and Human Services Agency(CHHS). Notable Spikes:
- Feb 17th -> President’s Day.
- March 13th -> People start hoarding groceries and medicine?
- April 5th -> The bottom of the series for the reduction in mobility around Parks.
- Memorial Day -> There is ~10% less movement (over the Jan-Feb base) as compared to President’s day in the Parks category.
- June 14th -> Corresponding to LA Protests.
Notable Trends:
- After mid-April people are staying home less and going to work, using transit, visiting parks, and doing shopping, more. This is a gradual but clear trend.
- There’s a clear spike of New Cases after June 14th. Where are these numbers coming from? We’ll separate LA Metro and Bay Area numbers so see.
- There is a steady increase in Retail and Recreation, along with the Workplace categories throughout June <- Opening Up.
- Update July 7th - New Cases on July 1st came down significantly. Why?
The table below provides a brief overview in the percentage of daily change in New Case Numbers, Growth Rates for the daily change, and the Rate of growth in Hospitalization and ICU admissions. Note the % ICU column. That’s the percentage of ICU Beds currently occupied by a Covid19 or suspected Covid19 patients.
| Date | Total Confirmed | New Cases | Total Hosp | ICU | % ICU | New ICU | Case Growth | 2X Period | Hosp: Confirmed | Hosp: ICU |
|---|---|---|---|---|---|---|---|---|---|---|
| 2020-07-27 | 466550 | 6000 | 8317 | 2198 | 77.23% | -23 | NA | NA | 1.78% | 26.43% |
| 2020-07-28 | 475305 | 8755 | 8439 | 2209 | 81.48% | 11 | 1.88% | 37 | 1.78% | 26.18% |
| 2020-07-29 | 485502 | 10197 | 8198 | 2220 | 87.13% | 11 | 2.15% | 32 | 1.69% | 27.08% |
| 2020-07-30 | 493588 | 8086 | 7997 | 2163 | 86.97% | -57 | 1.67% | 42 | 1.62% | 27.05% |
| 2020-07-31 | 500130 | 6542 | 7772 | 2120 | 87.39% | -43 | 1.33% | 52 | 1.55% | 27.28% |
| 2020-08-01 | 509162 | 9032 | 7761 | 2119 | 81.75% | -1 | 1.81% | 38 | 1.52% | 27.30% |
| 2020-08-02 | 514901 | 5739 | 7645 | 2069 | 79.73% | -50 | 1.13% | 61 | 1.48% | 27.06% |
| 2020-08-03 | 519427 | 4526 | 7630 | 2082 | 76.91% | 13 | 0.88% | 79 | 1.47% | 27.29% |
| 2020-08-04 | 524722 | 5295 | 7552 | 2005 | 77.74% | -77 | 1.02% | 68 | 1.44% | 26.55% |
| 2020-08-05 | 529980 | 5258 | 7485 | 2026 | 78.25% | 21 | 1.00% | 69 | 1.41% | 27.07% |
Comparing Bay Area and LA Metropolitan Area Mobility - June
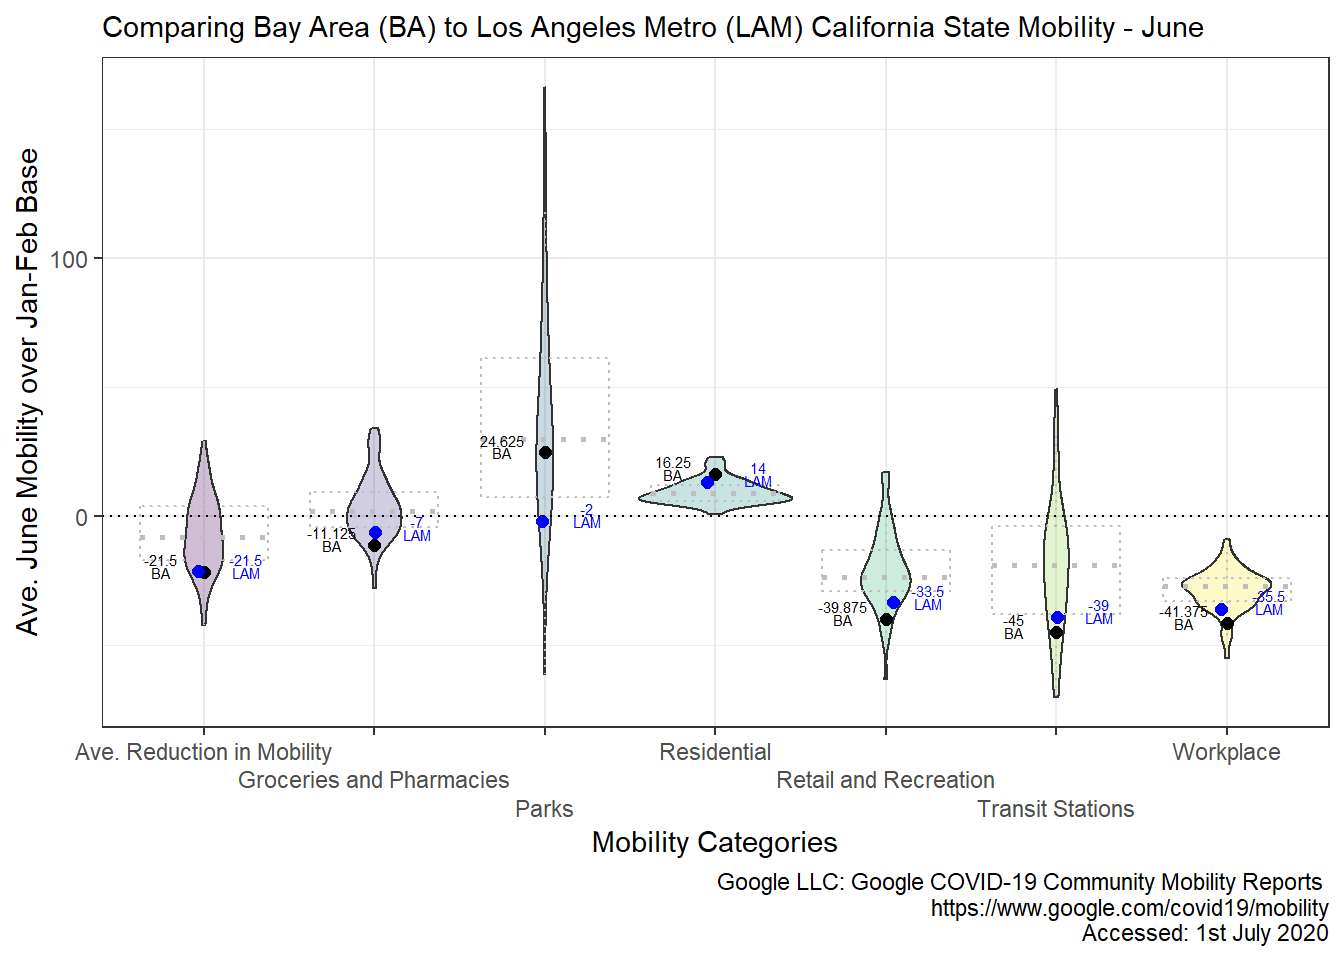
Interpretation of the Plot
Average Mobility Reduction across BA and LAM is virtually the same, but there are differences in other categories, most notably in the Parks category. We have to break down the two areas to see which counties are driving the numbers, but also to figure out if there is something that can be done about it with respect to Mobility.