Updated 6/24/2020 - CA Numbers are definitely rising. Why? There’s a spike in the Parks Mobility Category on June 14th which corressponds to protests in LA; smaller spikes on June 7th - 9th, too. Are events in LA driving the CA numbers given that 4 out of the top 5 Counties driving the CA numbers are in and around the LA Metropolitan Area? We will have to seperate them out and see if that it the case. The number of daily suspected cases are the same as they were at the height of the Mobility Restrictions. This within itself should be expected given that the base has increased over that period of time. What would be concerning is the rate of growth. We’ll break it down shortly in a subsequent post.
We have a WhatsApp group where we share Covid19 related information and engage in discussion. A friend forwarded and article by the Washington Post reporting a significant uptick in hospitalizations following Memorial Day. Good weather, the duration of the Shelter in Place, and mask-wearing - plus an awareness of hygiene? - were, probably, enough to get many people out and about. However, beyond Memorial Day itself, the unnecessary and horrendous, killing of George Floyd has also led to several days of protests in the Bay Area, among other places.
Banerjee, Duflo and Kemer won the Nobel prize for economics last year “for their experimental approach to alleviating global poverty”. The experimental approach referred to, here, is the one usually adopted in a scientific setting ie where randomized cohorts are used to create Test and Control arms to compare the effect of an intervention or perturbation. More about the winners and their work here. This approach is considered the best way to generate scientific evidence. However, it isn’t always possible to conduct randomized controlled trials (RCTs). In Medicine and Healthcare, along with other fields of study, where Humans are the subjects, Logitundinal Studies lead to the next-best - and often the only - level of scientific evidence. Here, the responses of all the subjects to changes, interventions or perturbations, are studied over time; usually with the subject baselines acting as a control.
The Covid19 episode will be studied in such a manner - along with RCTs where possible - by almost everyone engaged in research and data analysis, at least informally, if not, formally. This will lead to a lot of information which will need to be synthesized from a theory-making perspective, but that is another post.
In a similar vein, there are a few questions that have arisen in my mind over the last 2 weeks:
Will the loosening of the Lock-down lead to an increase in Covid19 hospitalizations?
- If so, what is the lag time between increased mobility and hospitalization?
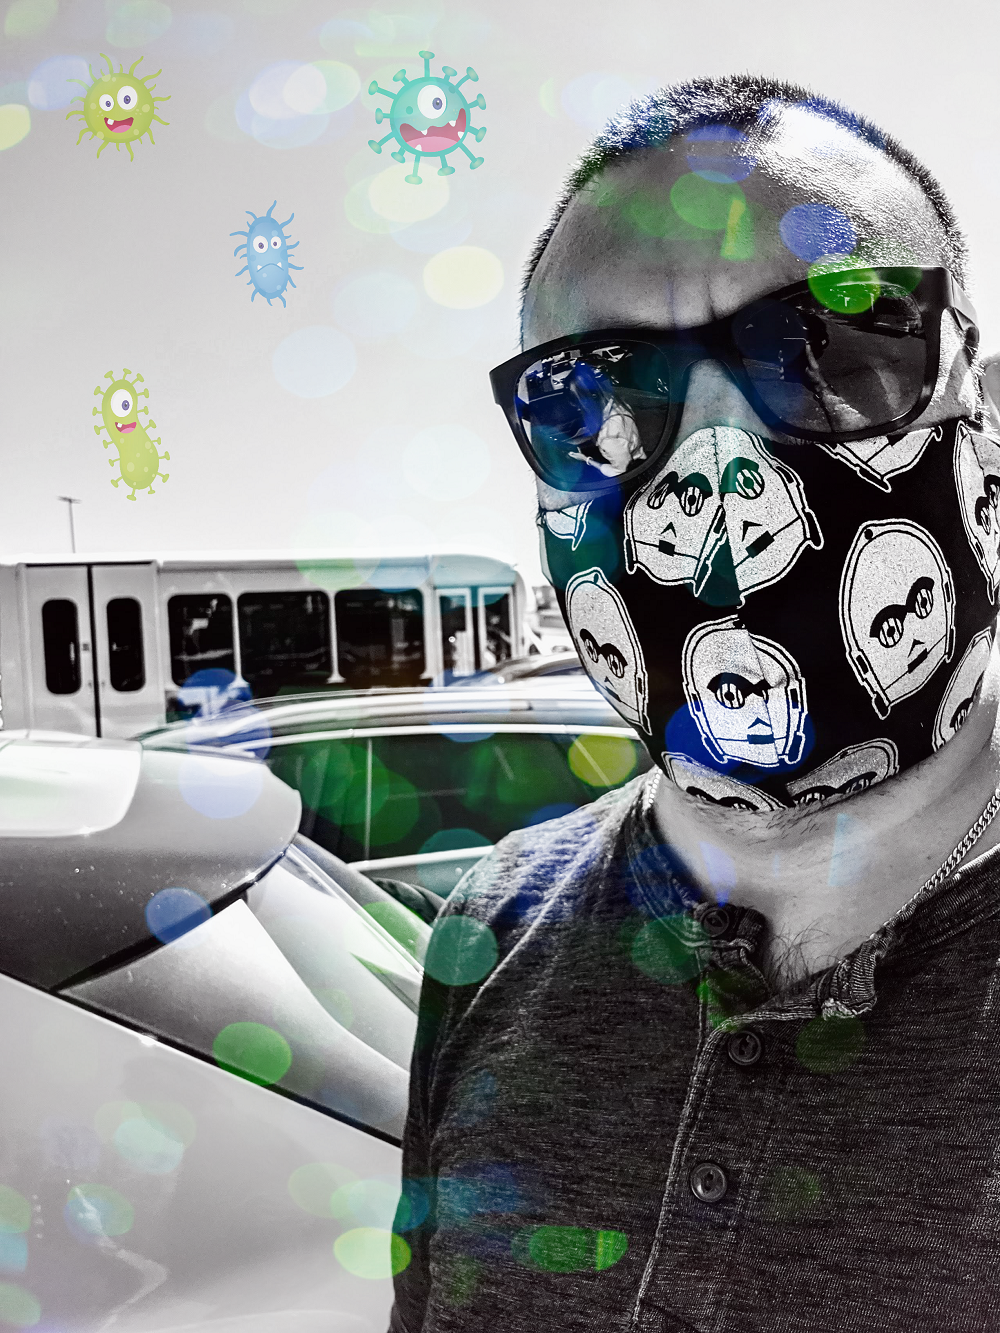
Will mask-wearing prevent an increase in Covid19 numbers?
Will protests result in an increase in Covid19 numbers?
Let’s look at the numbers from California to see if we can answer these questions.
Interpretation of the plot
This is a time-series plot comparing the change in mobility categories (non-grey colors) as measured by Google’s Mobility Data to the number of Potential Cases of Covid19 (in grey) as documented by California’s Health and Human Services Agency(CHHS). What is this category? CHHS records Confirmed and Suspected Covid19 cases. I summed those two categories to create a broader potential cases category because I wanted to observe the largest possible effect due to increased mobility. Covid19 isn’t the only infectious respiratory disease out there!
Notable Spikes:
- Feb 17th -> President’s Day.
- March 13th -> People start hoarding groceries and medicine?
- April 5th -> The bottom of the series for the reduction in mobility around Parks.
- Memorial Day -> There is ~10% less movement (over the Jan-Feb base) as compared to President’s day in the Parks category.
- May 29th -> The lowest daily potential cases in California.
Notable Trends:
- After mid-April people are staying home less and going to work, using transit, visiting parks, and doing shopping, more. This is a gradual but clear trend.
- CHHS only starts reporting data in April.
- There seems to be a steady state of new cases despite the Shelter in Place (SiP). This leads one to believe that increased mobility to result in a rise of case numbers -> hospitalizations -> Deaths.
- There is a small upward slope from May 29th <- Is this material?
To answer that question, let’s look at the Growth Rate of New Cases and ICU Hospitalizations (Covid confirmed + Covid suspected).
| Date | Potential Cases | Potential ICU Cases | Growth Rate Cases | Doubling Period | Growth Rate ICU | Doubling Period ICU |
|---|---|---|---|---|---|---|
| 06/04/2020 | 4625 | 1333 | 3.82% | 18 | 4.22% | 16 |
| 06/05/2020 | 4526 | 1315 | -2.14% | -32 | -1.35% | -51 |
| 06/06/2020 | 4525 | 1288 | -0.02% | -3137 | -2.05% | -34 |
| 06/07/2020 | 4506 | 1301 | -0.42% | -165 | 1.01% | 69 |
| 06/08/2020 | 4583 | 1345 | 1.71% | 41 | 3.38% | 20 |
| 06/09/2020 | 4719 | 1326 | 2.97% | 23 | -1.41% | -49 |
Answering the Questions:
- Will the loosening of the Lock-down lead to an increase in Covid19 hospitalizations?
- The changes in Case numbers and ICU admissions for the 4th and the 9th of June seem curious given what we know about the incubation time.
- Those dates are 10 and 15 days after Memorial Day.
- However, the days in between don’t trend similarly.
- Conclusion: The data doesn’t show a clear trend and don’t qualify as a significant spike, without delving into semantics.
- Further data is needed to ascertain if there will be an increase, and if there is a lag-effect beyond 15 days. Knowing what we know about the way in which the disease spreads, there could be a gradual increase in numbers.
- Will mask-wearing prevent an increase in Covid19 numbers?
- I don’t think we can say, either way, given the data.
- This is something that I’ll revisit in a week’s time.
- We’ll try and do some statistical analysis too.
- Given the mixed messages from WHO on asymptomatic spread this is an important question to answer.
- Arstechnica does a good job of breaking-down what WHO means
- A note on why pre-symptomatic is probably the target for mask-wearing prevention. Think about it this way. Symptoms occur because a virus causes an immune response + damage to the body. If a person never develops symptoms that means the their immune response was so efficient that they developed anti-bodies to rid the host of the virus, hence the probability of shedding the virus is less in comparison to the pre-symptomatic category. Why? The virus needs to replicate in order to spread (and hence shed). If the virus is replicating, then it is causing damage to cells, which means that symptoms will develop. If symptoms don’t develop ie the body has done an effective job of neutralizing viral replication, then there isn’t much of the virus to shed. Breaking down Medicine into small chunks that can be visualized is an effective way of understanding patho-physiology.
- This is why testing and contact tracing is important. Expect the verbiage to change in the content one reads. The conversation around mask-wearing will probably gravitate towards pre-symptomatic spread.
- A note on why pre-symptomatic is probably the target for mask-wearing prevention. Think about it this way. Symptoms occur because a virus causes an immune response + damage to the body. If a person never develops symptoms that means the their immune response was so efficient that they developed anti-bodies to rid the host of the virus, hence the probability of shedding the virus is less in comparison to the pre-symptomatic category. Why? The virus needs to replicate in order to spread (and hence shed). If the virus is replicating, then it is causing damage to cells, which means that symptoms will develop. If symptoms don’t develop ie the body has done an effective job of neutralizing viral replication, then there isn’t much of the virus to shed. Breaking down Medicine into small chunks that can be visualized is an effective way of understanding patho-physiology.
- There doesn’t seem to be a marked increase in case numbers, so far.
- Will protests result in an increase in Covid19 numbers?
- There is no evidence that suggests that may be the case, or it is too early to tell.
- We’ll revisit this in a week’s time, too. But does mask-wearing help?
- We’ll have to decide how we measure the quanta of protests wrt to mobility data, too. Which category do you think best reflects the activity of protesting? Teasing out the impact of one over the other may not be easy with just California Data. We may need to look at other geographies ie more data = better analysis, but also, additional confounding factors.
Overall Conclusion
Looking at the Mobility Data from Google, along with the Case and ICU numbers from the State of California, without going into statistical significance of those numbers and semantics, it is too early to tell if there is an increasing trend for Covid19 infection after Memorial Day.