
June is the hottest month in North India. And as the snows have melted in the Himalayas, the Chinese State has started border skirmishes to deflect from the pressure of being put in a global Covid19 spotlight. This is as predictable as it is pathetic given the reporting that has emerged regarding how they hid the severity and the nature of the disease in late December and early January - CNN and AP.
A swarm of locusts have invaded from across the Pakistan border (no fault of Pakistan) and threatened local agriculture. And Lock-down phase 4.0 has ended midst a heatwave which means people are moving out and about and trying to resume their economic lives. The two recent cyclones, Amphan and Nisarga make a bad situation worse for coastal states, and oh, Polio prevention is behind schedule 😒
While India had issued an advisory to students in Wuhan in mid January, and arranged for their evacuation after Wuhan was put under a lock-down, it is only in mid March that Delhi issues restrictions, and then a week later, India issued a national restriction of movement and closure. How has India fared since mid March? Broadly, there are three lenses through which to view the last two and a half months. Crudely, India’s performance can be measured against the number of lives not lost at the cost of the economy, on the back of India’s largely poor labor force.
How severe was India’s lock-down?
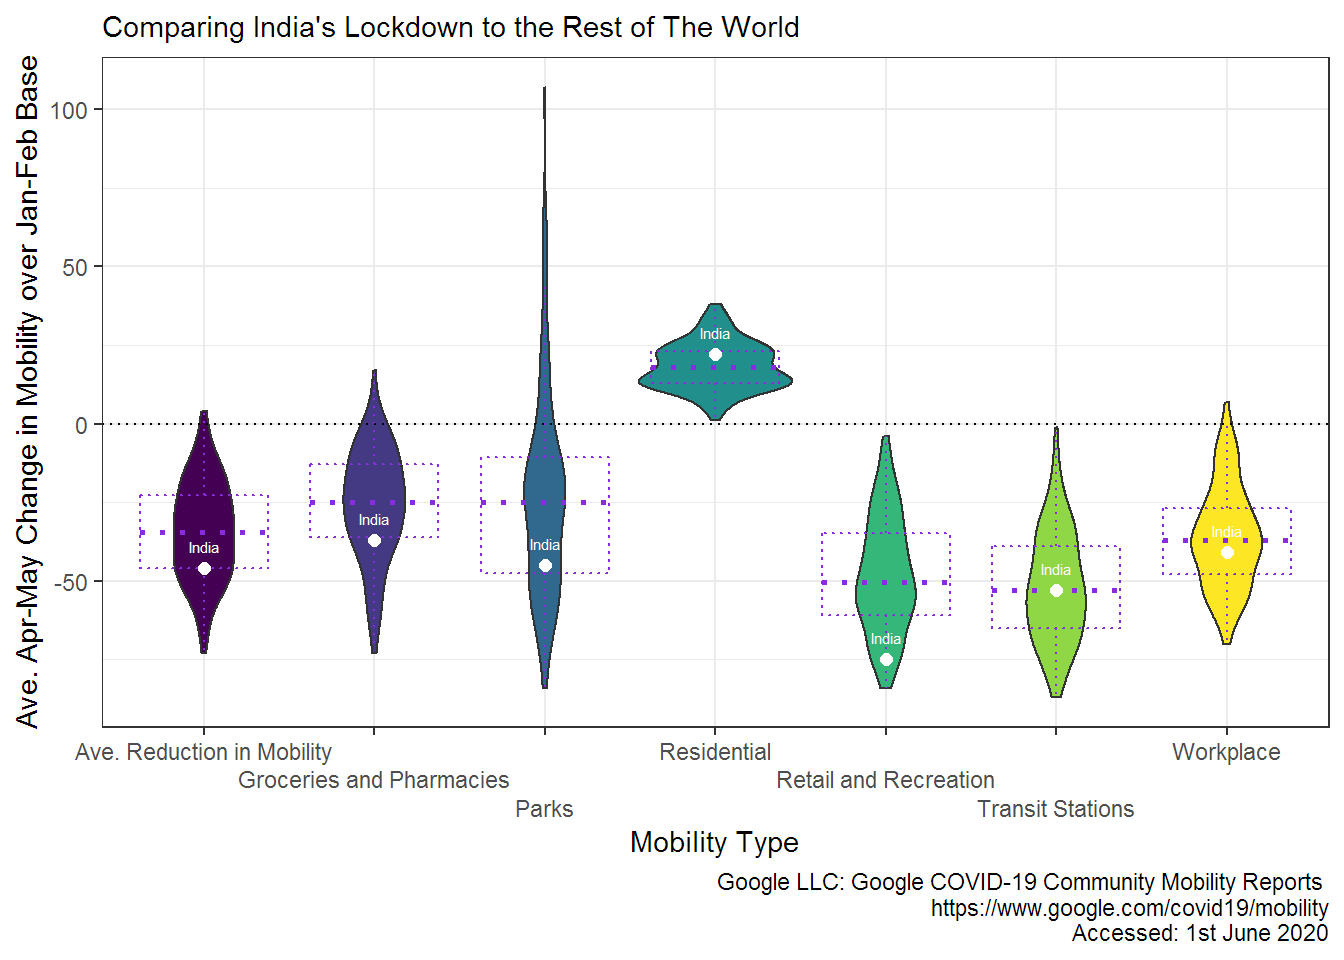
The above graphic is a box-plot (purple dash) cum violin plot and shows the reduction of mobility in India (white dot) as it compares to the rest of the world as measured by Google’s Mobility Data. The shape of the violin shows the bulk of the data as compared to the IQRs (Inter Quartile Range). Points to note:
- Average Reduction in Mobility
- India’s reduction in Mobility was ~ 40% below normal as measured in the beginning of the year.
- This reduction in mobility sits on the 1st Quartile ie 75% of the world had, on average, a lesser average reduction in mobility.
- There was a similar reduction in mobility (in comparison to the world) for the Groceries and Pharmacies, Parks, and Residential categories.
- Retail and Recreation
- Here India’s reduction is close to 75%
- This is much lower than anywhere else in the world.
- Transit and Workplace
- India sits in the median ie most common reduction in comparison to the rest of the world.
Comparing Mobility within India - Select States
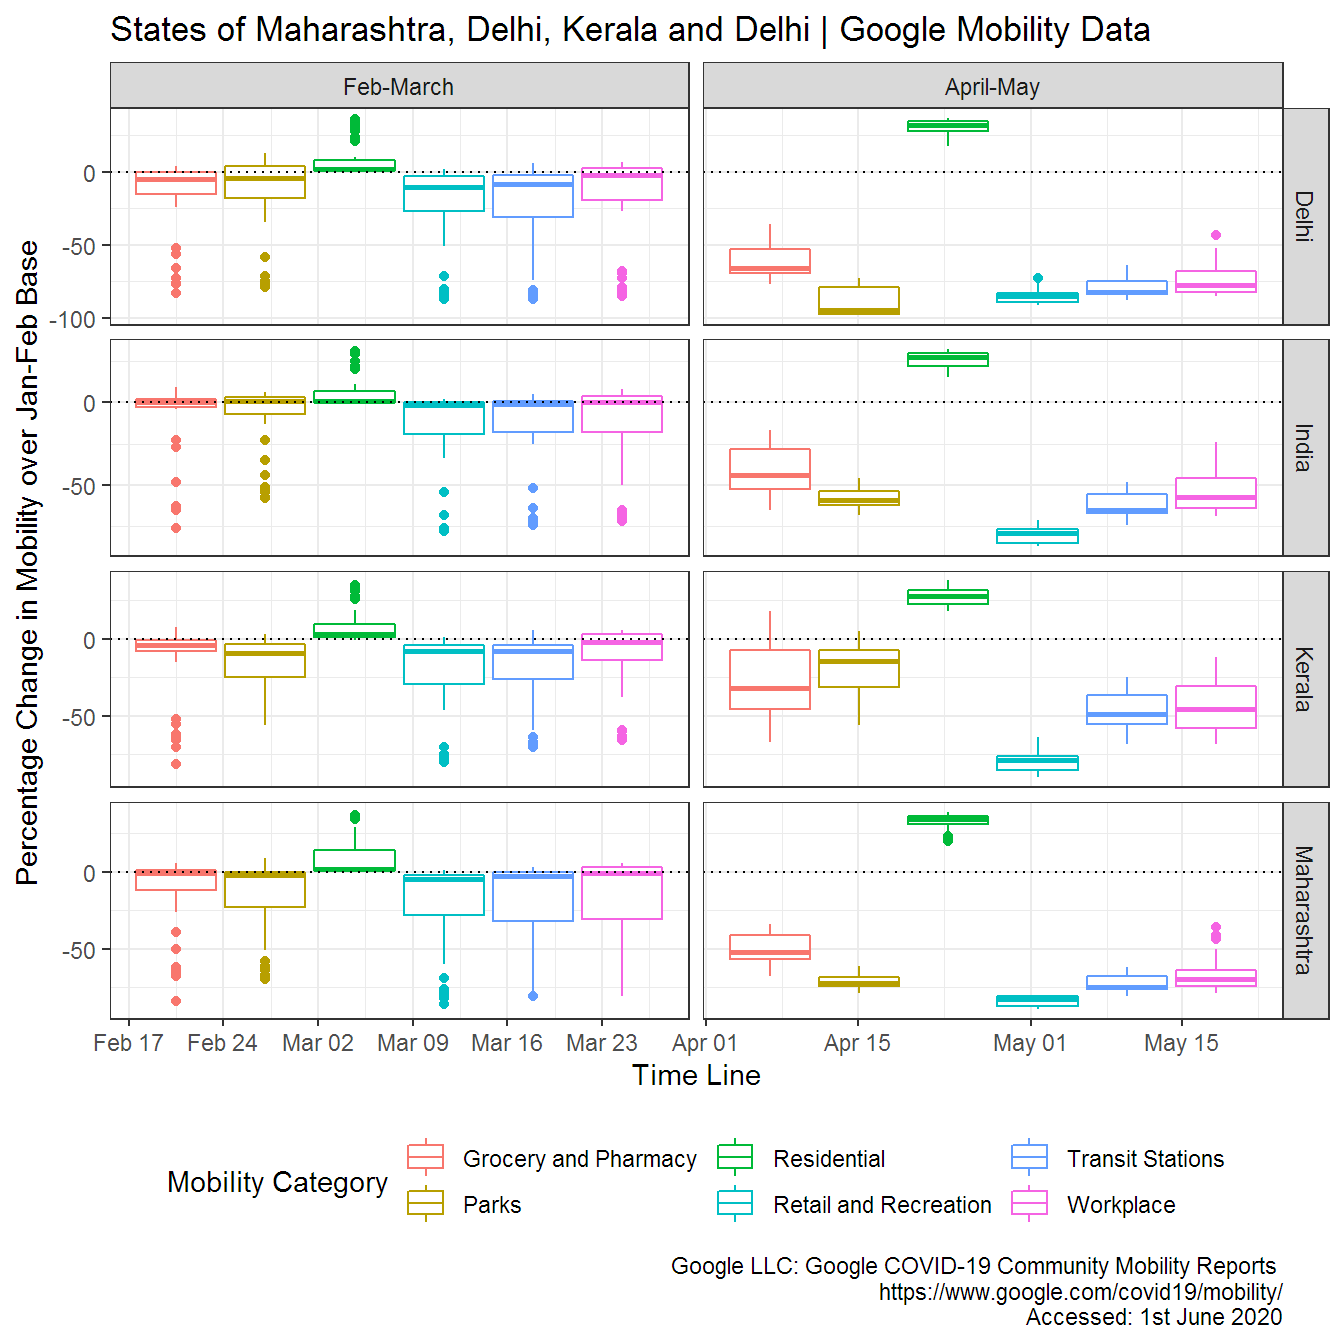
These box-plots provide a sample state wise comparison in the reduction of mobility of various categories. Note how Delhi and Maharashtra compare to the pan-India and Kerala numbers with respect to the reduction in mobility for the Grocery and Pharmacy category. Delhi’s lock-down of this category was the most severe, followed by Maharashtra. In comparison, Kerala’s reduction was less severe. Perhaps this may explain why there was an exodus of labor from the two states. It’s unclear how good a proxy, Google’s mobility data is, because it’s unclear how this data is generated. Assuming it is gathered from cellular phones with data capability, it may not be the best method to measure reduction in mobility across all socio-economic strata. However, mobile phone internet usage stands at about 32% in India and data generated from here may be good enough.
End of May - Early June World Snapshot as of 2020-06-04.
The restriction in movement, along with other measures, seems to have led to some countries in Europe navigating the first wave; note the deaths per million, however.
| Country | New Cases | Total Confirmed | Active | Deaths | Deaths Per M | Growth Rate | Doubling Period |
|---|---|---|---|---|---|---|---|
| United States | 21140 | 1872660 | 1279447 | 108211 | 331 | 1% | 61 |
| Brazil | 30925 | 614941 | 325957 | 34021 | 162 | 5% | 13 |
| Russia | 8823 | 440538 | 230965 | 5376 | 37 | 2% | 34 |
| United Kingdom | 1805 | 281661 | 241757 | 39904 | 600 | 0% | 107 |
| Spain | 334 | 240660 | 63151 | 27133 | 580 | 0% | 499 |
| Italy | 177 | 234013 | 38429 | 33689 | 558 | 0% | 916 |
| India | 9889 | 226713 | 111900 | 6363 | 5 | 4% | 15 |
| France | -2850 | 185986 | 89466 | 29010 | 433 | -1% | -46 |
| Germany | 351 | 184472 | 7928 | 8635 | 104 | 0% | 364 |
| Turkey | 988 | 167410 | 31002 | 4630 | 56 | 0% | 117 |
In comparison, India has so far been able to keep deaths relatively low. While doubling time is currently 15 days, with the restrictions lifting, expect the number of new cases to increase. Given India’s population, it is inevitable India will top this table, however, the challenge in front of it and its citizens, is one of mitigating the number of deaths due to infection, while continuing with economic activity.
In a subsequent post, we’ll compare daily case and infection loads with India’s strategy of at-home quarantine of positive cases, along with hospital capacity. We’ll also compare state level GDP data to ascertain the impact of restrictions and see if there is a baseline model that can predict case numbers as the economy tries to sputter back to life.
6/6/2020 Update: In response to recent article suggesting that the R0 may have fallen below 1 in Maharashtra (the state with the highest numbers), a summary table with the doubling time has been included. We’ll continue to watch this to see how it plays out because it will have a significant impact on the trajectory of the disease.
| Date | Total Cases | CFR | Growth Rate | Doubling Period |
|---|---|---|---|---|
| 2020-05-31 | 65168 | 3.37% | 4.75% | 15 |
| 2020-06-01 | 67655 | 3.38% | 3.82% | 18 |
| 2020-06-02 | 70013 | 3.37% | 3.49% | 20 |
| 2020-06-03 | 72300 | 3.41% | 3.27% | 21 |
| 2020-06-06 | 80229 | 3.55% | 3.66% | 19 |